
U.S. Weather Splits in Two: Bitter Wind Chills in the East While Southwest Warmth Surges, Map Shows
UNITED STATES — A striking national wind chill/heat index map is highlighting a clean, high-contrast weather divide across the country, with extreme cold plunging deep into the Eastern U.S. while unseasonable warmth pushes north from the Southwest. The result is a boundary that appears to cut the nation almost in half—opposite extremes happening at the same time.
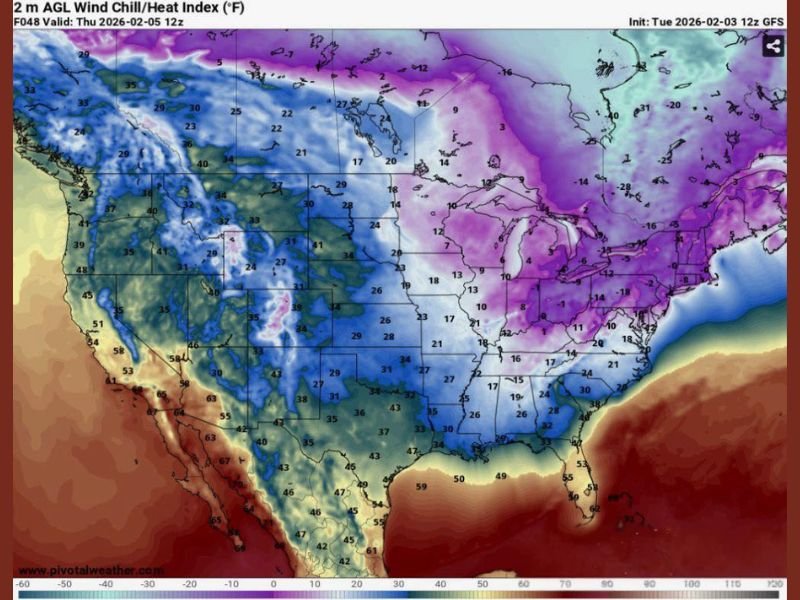
The forecast graphic shown is labeled “2 m AGL Wind Chill/Heat Index (°F)” and displays conditions valid Thursday, February 5, 2026, with the model initialization noted as Tuesday, February 3, 2026. The message in the accompanying text is not presented as a conclusion, but as an observation: when contrasts line up this sharply, it’s a pattern worth watching.
What the map shows in the Eastern U.S.
Across much of the East, the shading indicates very cold “feels-like” conditions, with widespread areas in the teens and single digits and pockets that dip below zero, particularly across parts of the Great Lakes, interior Northeast, and into sections of New England and eastern Canada. The deeper purples and blues on the map suggest the type of cold that can quickly become dangerous when wind is involved, especially during morning hours and overnight periods.
Even farther south, the map shows a broad area of 30s and 20s “feels-like” values spreading across portions of the Southeast and mid-Atlantic, reinforcing that the cold is not confined to the northern tier.
What the map shows in the Southwest
At the same time, the Southwest appears locked into a much warmer regime, with the orange and red shading indicating 50s and 60s and locally higher values closer to the far Southwest and northern Mexico. The warm push is shown building northward, creating a sharp thermal gradient where mild air and bitter cold sit relatively close together across the central part of the country.
That type of setup often intensifies weather contrasts because it establishes a strong boundary zone—one side dominated by Arctic influence, the other by milder, subtropical air.
Why the “boundary” matters
The most important feature in the data isn’t just the cold or the warmth by itself—it’s the sharp line between them. When the country is divided like this, small shifts in the pattern can quickly change impacts region-by-region. A boundary that tight can also create active transitions where storm systems ride along the contrast zone, depending on timing and atmospheric support.
The text shown with the map calls the pattern “not random” in appearance and emphasizes that it’s unusual to see contrasts line up this clean across such a wide area at once.
What to watch over the next several days
The data points to a near-term period where regional experiences will be radically different—winter-like wind chills dominating the East while spring-like warmth presses from the Southwest. If the boundary shifts east or west, it could change who feels the worst of the cold and where the milder air expands.
Are you feeling this split where you live—deep cold, unusual warmth, or a sharp change from day to day? Share what you’re seeing and keep following NapervilleLocal.com for weather pattern updates as February unfolds.

I’ve lived in Naperville long enough to see how quickly our community changes — from new developments downtown to sudden shifts in our Midwest weather. Reporting on Naperville news and daily forecasts gives me the chance to keep neighbors informed about what really matters. My goal is simple: deliver clear, timely updates so you always know what’s happening in our city and what to expect from the skies above.